
Understanding candlestick patterns is a critical skill for anyone involved in trading. This comprehensive guide will walk you through the basics of candlestick patterns, offering valuable insights into how to read and interpret these essential indicators. Whether you’re a beginner or an experienced trader, mastering these patterns can significantly enhance your trading strategies.
Candlestick patterns are visual representations of price movements in the financial markets. They provide traders with insights into market sentiment and potential future price movements. Each candlestick on a chart encapsulates a specific period’s price action, offering a snapshot of market behavior.
Introduction to Candlestick Patterns
Candlestick patterns have been used for centuries, originating in Japan during the 18th century. They were developed by rice traders to predict future price movements based on historical data. Today, these patterns are widely used in various financial markets, including stocks, forex, and commodities.
Understanding the basic structure of a candlestick is crucial. Each candlestick comprises four key components: the open, high, low, and close prices within a specific time frame. The body of the candlestick represents the range between the open and close prices, while the wicks (or shadows) indicate the highest and lowest prices during that period.
Why Candlestick Patterns Matter
Candlestick patterns are invaluable tools for traders because they provide a visual representation of market psychology. They reveal the battle between buyers (bulls) and sellers (bears) and help traders identify potential turning points in the market. By analyzing these patterns, traders can make more informed decisions and develop effective trading strategies.
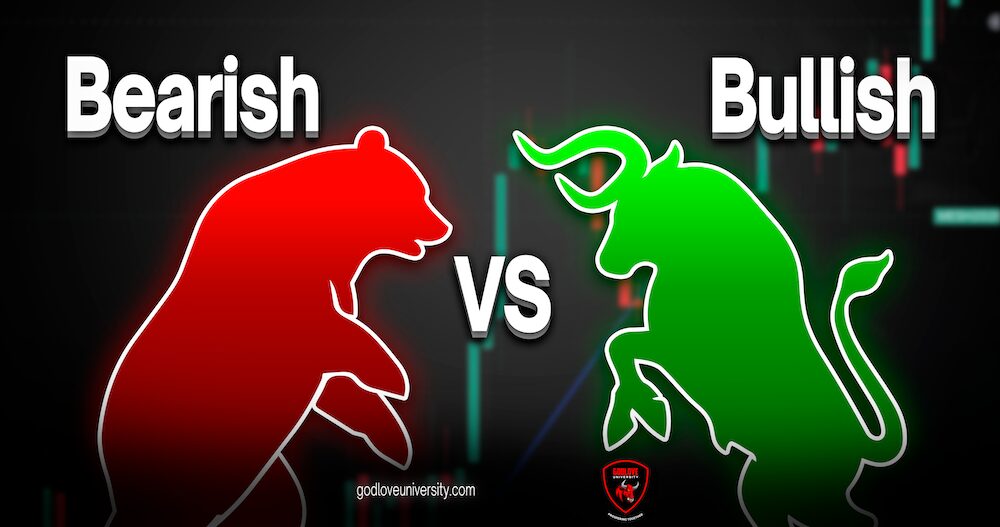
Bullish and Bearish Patterns
Candlestick patterns can be classified into two main categories: bullish and bearish. Bullish patterns indicate potential upward price movements, while bearish patterns suggest potential downward movements. Some of the most common bullish patterns include the Hammer, Bullish Engulfing, and Morning Star. On the other hand, bearish patterns include the Hanging Man, Bearish Engulfing, and Evening Star.
Single Candlestick Patterns
Single candlestick patterns are formed by a single candlestick and can provide valuable insights into potential market reversals or continuations. One of the most well-known single candlestick patterns is the Doji. A Doji occurs when the open and close prices are virtually identical, indicating indecision in the market. This pattern can signal a potential reversal, especially when it appears after a strong trend.
Multiple Candlestick Patterns
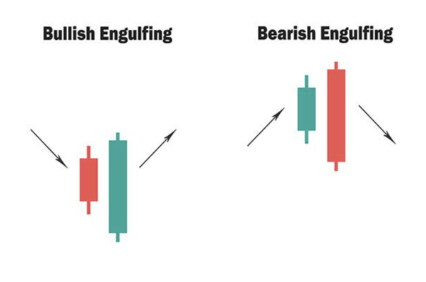
Multiple candlestick patterns involve two or more candlesticks and can provide more complex signals. For example, the Bullish Engulfing pattern consists of a small bearish candlestick followed by a larger bullish candlestick that completely engulfs the previous one. This pattern suggests a potential reversal from a downtrend to an uptrend.
Another important multiple candlestick pattern is the Morning Star, which is a three-candlestick pattern indicating a bullish reversal. It begins with a long bearish candlestick, followed by a small candlestick that gaps down, and ends with a long bullish candlestick that closes above the midpoint of the first candlestick.
Applying Candlestick Patterns in Trading
To effectively use candlestick patterns in trading, it’s essential to consider their context within the broader market environment. Combining candlestick patterns with other technical analysis tools, such as support and resistance levels, moving averages, and volume indicators, can enhance the accuracy of your trading decisions.
For example, if a Bullish Engulfing pattern forms at a significant support level, it may indicate a strong buying opportunity. Conversely, if a Bearish Engulfing pattern appears at a key resistance level, it could signal a potential selling opportunity.
Conclusion
Mastering candlestick patterns is a fundamental skill for traders seeking to improve their market analysis and trading strategies. By understanding the basic structure of candlesticks and recognizing key patterns, traders can gain valuable insights into market sentiment and potential price movements.
In the next part of this series, we will delve deeper into specific candlestick patterns and explore advanced techniques for integrating them into your trading strategy. Stay tuned for more in-depth analysis and practical tips to enhance your trading skills.
Frequently Asked Questions
What are candlestick patterns? Candlestick patterns are visual representations of price movements in financial markets. They help traders understand market sentiment and potential future price movements by analyzing the open, high, low, and close prices within a specific time frame.
Why are candlestick patterns important in trading? Candlestick patterns provide insights into market psychology and help traders identify potential turning points. By recognizing these patterns, traders can make more informed decisions and develop effective trading strategies.
What is the difference between bullish and bearish candlestick patterns? Bullish patterns indicate potential upward price movements, while bearish patterns suggest potential downward movements. Examples of bullish patterns include the Hammer and Bullish Engulfing, while bearish patterns include the Hanging Man and Bearish Engulfing.
How can I use candlestick patterns in my trading strategy? To effectively use candlestick patterns, consider their context within the broader market environment and combine them with other technical analysis tools. This approach enhances the accuracy of your trading decisions and helps you identify potential buying or selling opportunities.
What is the Bullish Engulfing pattern? The Bullish Engulfing pattern consists of a small bearish candlestick followed by a larger bullish candlestick that completely engulfs the previous one. This pattern suggests a potential reversal from a downtrend to an uptrend.
Stay tuned for the next part of our candlestick cheat sheet series, where we will continue to explore more patterns and advanced trading techniques. For those interested in a comprehensive guide, our Candlestick Cheat Sheet download will soon be available.