
Candlestick patterns provide an invaluable tool for traders aiming to understand market dynamics. In this second part of our series, we delve deeper into more complex candlestick patterns and explore how these patterns can be integrated into effective trading strategies. Building on the basics discussed in Part 1, this guide offers advanced insights into interpreting market movements and making informed trading decisions.
Candlestick patterns are more than just visual representations of price movements; they encapsulate the emotions and psychology of market participants. By mastering these patterns, traders can gain a significant edge in predicting future price movements.
Understanding Complex Candlestick Patterns
While single and simple multiple candlestick patterns are essential, more complex patterns provide deeper insights into market trends. Recognizing and understanding these advanced patterns can enhance a trader’s ability to anticipate market movements.
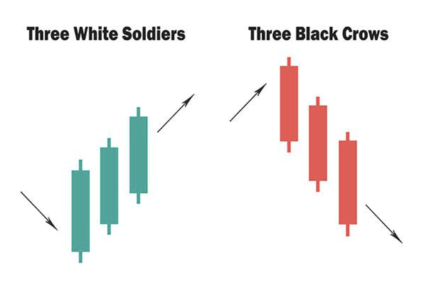
The Three Black Crows Pattern
The Three Black Crows pattern is a bearish reversal pattern consisting of three consecutive long bearish candlesticks. Each candlestick opens within the previous candle’s body and closes near its low, indicating sustained selling pressure. This pattern suggests that the bears have taken control, potentially signaling the beginning of a downtrend.
The Three White Soldiers Pattern
In contrast, the Three White Soldiers pattern is a bullish reversal pattern comprising three consecutive long bullish candlesticks. Each candlestick opens within the previous candle’s body and closes near its high, demonstrating strong buying interest. This pattern indicates that the bulls are gaining momentum, potentially leading to an upward trend.
Incorporating Candlestick Patterns into Trading Strategies
To effectively use candlestick patterns in trading, it’s crucial to consider them within the broader market context. Integrating these patterns with other technical analysis tools can enhance their predictive power and improve trading decisions.
Combining Candlestick Patterns with Support and Resistance Levels
Support and resistance levels are critical components of technical analysis. They represent price levels where buying or selling pressure is expected to emerge. Combining candlestick patterns with these levels can provide more accurate signals. For instance, a Bullish Engulfing pattern forming at a significant support level could indicate a strong buying opportunity.
Using Moving Averages to Confirm Patterns
Moving averages help smooth out price data, making it easier to identify trends. Traders often use them to confirm candlestick patterns. For example, if a Three White Soldiers pattern forms above a rising moving average, it strengthens the signal of an uptrend. Conversely, a Three Black Crows pattern below a declining moving average reinforces the bearish signal.
Volume Analysis to Validate Candlestick Patterns
Volume is a crucial factor in validating candlestick patterns. High volume accompanying a pattern often confirms its reliability. For example, a Piercing Pattern with high volume suggests strong buying interest, increasing the likelihood of a bullish reversal. Similarly, a Dark Cloud Cover pattern with significant volume indicates strong selling pressure, confirming the bearish reversal.
Advanced Trading Strategies with Candlestick Patterns
Developing advanced trading strategies involves combining multiple technical analysis tools with candlestick patterns. These strategies help traders maximize their potential gains while minimizing risks.
Swing Trading with Candlestick Patterns
Swing trading involves capturing short- to medium-term price movements. Traders using this strategy often rely on candlestick patterns to identify potential entry and exit points. For instance, after identifying a Bullish Engulfing pattern at a support level, a swing trader might enter a long position and hold it until a bearish pattern or a significant resistance level appears.
Trend Reversal Strategies
Trend reversal strategies focus on identifying points where the current trend is likely to reverse. Candlestick patterns play a vital role in these strategies. For example, a trader might look for a Three Black Crows pattern at the end of an uptrend to signal a potential short position. Combining this pattern with other indicators, such as relative strength index (RSI) or moving average convergence divergence (MACD), can increase the strategy’s effectiveness.
Risk Management with Candlestick Patterns
Effective risk management is essential for successful trading. Candlestick patterns can help traders set stop-loss and take-profit levels. For instance, after entering a trade based on a Bullish Engulfing pattern, a trader might set a stop-loss below the pattern’s low and a take-profit at a nearby resistance level.
Conclusion
Mastering advanced candlestick patterns and integrating them into comprehensive trading strategies can significantly enhance a trader’s performance. By understanding complex patterns like the Three Black Crows, Three White Soldiers, Dark Cloud Cover, and Piercing Pattern, traders can make more informed decisions and improve their market predictions.
In the final part of our series, we will explore even more intricate patterns and delve into real-world examples of successful trading strategies using candlestick patterns. Stay tuned for more insights and practical tips to elevate your trading skills.
Frequently Asked Questions
What is the Three Black Crows pattern?
The Three Black Crows pattern is a bearish reversal pattern consisting of three consecutive long bearish candlesticks. It indicates sustained selling pressure and a potential downtrend.
What does the Three White Soldiers pattern signify?
The Three White Soldiers pattern is a bullish reversal pattern comprising three consecutive long bullish candlesticks, indicating strong buying interest and a potential upward trend.
How important is volume in validating candlestick patterns?
Volume is crucial in validating candlestick patterns. High volume accompanying a pattern often confirms its reliability, indicating strong market interest and increasing the pattern’s predictive power.
What role do support and resistance levels play in candlestick pattern analysis?
Support and resistance levels are critical in technical analysis. Combining candlestick patterns with these levels can provide more accurate signals and help traders identify potential entry and exit points.
Stay tuned for the final part of our candlestick cheat sheet series, where we will continue to explore more advanced patterns and real-world trading strategies. For those interested in a comprehensive guide, our Candlestick Cheat Sheet download will soon be available.